Empower Young Scientists with Data Explorations
Building powerful science foundations for elementary learners
Students live in the age of data, and it’s playing a significant role in reshaping society and transforming the world. As a result, the ability to use data to make predictions, analyze and communicate information has become an essential life skill.
Data science is an interdisciplinary field that uses computer algorithms to analyze large amounts of data. Data Scientists examine the results to find patterns, derive understanding, share information, and make predictions.

The data science process can be simplified and adapted for implementation in elementary classrooms so that young students learn to:
- Develop and ask quality questions
- Collect and visualize data
- Analyze data and draw conclusions
- Communicate findings and take action
While the majority of young learners aren’t ready to write code or work with vast amounts of information, adapting this process can help you develop skills that help set essential foundations for data-driven thinking.
Get started with the right question
Like most great inquiry, the data science process needs to start with a good question. In their work, Tofade, Elsner, and Haines explain "student-initiated questions increase higher-order learning by requiring them to analyze information, connect seemingly disparate concepts, and articulate their thoughts."
“If I had an hour to solve a problem and my life depended on the solution, I would spend the first 55 minutes determining the proper question to ask. For once I know the proper question, I could solve the problem in less than five minutes.”
— Einstein
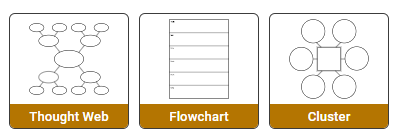
Graphic organizers make thinking visible for students and help them connect concepts and identify gaps in their knowledge. This is the space where questions are born. Use organizers like I See, I Wonder and Think-Puzzle-Explore to provide students with scaffolds to make meaningful observations and prompt inquiry.

Provide students with plenty of time to write their observations and craft good questions. Encourage students to make questions more precise so they can begin collecting the data they need. If students need to go further, prompt with questions like:
- What are we missing?
- Is this what we want to determine?
- What else can we ask?
Many classrooms create fun graphs on topics like a favorite food. But, after data is collected, the information isn’t used. Kicking off the project with a question like, “What treat should you bring to a summer party in the park?” still gets students to collect data on favorite treats, but then prompts them to use the data for the purpose of bring a treat more students will enjoy.
Collect and visualize data
Use a tally chart that provides a small range of choices for young learners who are not ready to collect data without guidance. A completed tally chart also provides a data visualization. Older students may be ready to craft and create their own surveys for collecting data. Students can capture or transfer data they collect using grid paper or digital spreadsheets.

Ask students to visualize the data they have collected using bar graphs, scatter plots and line charts. In the beginning, you may have to introduce them to each type of graph and direct their work, but eventually, students should be choosing how they can best display the data they have collected.

Show your students how to use the chart features in their spreadsheet application. These tools make it easy to translate data captured in rows and columns into a range of graphs and charts so they can focus on analyzing the data, not simply displaying it.
Analyze data and draw conclusions
With data collected and displayed in a visual form that is easier to understand, it’s time for students to analyze the data. Prompt student thinking with questions like:
- What is the graph trying to describe or tell me?
- Are the results surprising?
- Can we predict anything from the results?
Data Scientists look for patterns to help them make generalizations and understand results from one situation to another. Have students use a science journal to document their thinking and questions as they collect and analyze their data. This can better help them identify patterns.
Communicate findings and take action
Data Scientists are skilled communicators with the ability to take complex information and large amounts of data and make it easily understandable for their audience. Data science helps us identify trends and find solutions, but simply collecting and analyzing data doesn’t have any meaning unless the findings are used to help people make decisions and take action.
Students need to learn how to communicate their findings in ways that raise awareness and change behavior. Knowing the relevant audience for the question(s) students ask at the beginning of the process can help you identify the audience that needs to see and hear about their findings.
Infographics are a fun and relevant way to share large amounts of data in ways that make the information easy to understand. Students can craft info posters and infographics to both inform and prompt action.

Another way students can share data is through a story. Creating a digital story based on data requires learners to “distill essential ideas from their research, identifying reliable text and supplementing it with imagery, and synthesize this knowledge into a deliverable that evidences their mastery of the content being studied.”
Working with data provides students with an opportunity to see how making sense of numbers and information can help them make real-world decisions and take action. Communicating their findings to an audience outside the classroom moves their work beyond just an academic exercise to one that can help make the world a better place and serve as additional motivation for their efforts.
One action students may decide to take on their own is to ask a different question based on their findings. This models the iterative process data scientists follow in the real world.
Young learners can be data scientists
The data science process helps students develop inquiry and critical thinking skills and builds essential foundations for future success in STEM subjects and careers. And all students, including our youngest learners, deserve opportunities to get involved in the exciting world of data exploration.