Infographics
Students will create an infographic to share knowledge and data about an issue or science topic they are studying.

Task
Infographics are an increasingly popular way of sharing information in newspapers, magazines, and online news sites. These visual representations of knowledge and information are designed to make complex ideas and large amounts of data easy to understand. There are many ways to create infographics. After exploring a variety of examples, you will create your own infographic poster that will help others better understand an issue or concept you are studying.
Engage
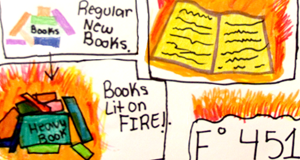
By now, most students have seen an infographic, but may not have thought about how they are used to help share data and information. Share a few sample infographics that are relevant to your classroom content and/or students’ interests. Here are a few examples to get you started. Explore your text books, support resources, and classroom posters for more examples.
You can also share a snippet from the “Beauty of Data Visualization” TED Talk by David McCandless. Consider assigning this as homework prior to beginning the project.
Ask students for their reactions after watching the video and exploring examples. Ask questions that elicit opinions to engage students in the discussion, such as:
- Which infographic was the best? Why?
- What made them interesting, content or design? Or both?
- How did the use of fonts, color, graphics, and imagery contribute?
- Did the design contribute to how you felt about the information?
Let students know they will create infographic posters for an issue or topic in your class. Provide students, or small teams, with a list of topics and/or issues they can choose from. If your goal is related to curriculum content, you may want to ensure a variety of topics and content coverage, but if the goal is learning to show data and communicate visually, you can let students choose topics to explore.
Create
The process begins not with making the infographic, but with research. Students will need time to research their selected concept as well as think about how they will visually convey it. Assess for understanding and comprehension of the content as they as they collect and clarify information.
Infographics, especially those that include lots of data, ALWAYS include citations. Take a moment to remind your students to capture citations for information they are including in their posters.

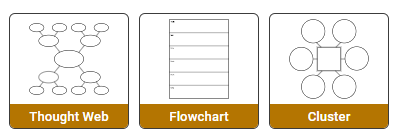
When their notes are complete and they are confident about the information and their knowledge of it, students/ teams should produce a rough visual sketch of how they will share the information. Organization and design of the poster will be critical in informing others. Check in again to evaluate how well they are thinking about representing data and information.
As they plan out design, students should ask and answer questions like:
- Which information, facts, and data are essential to include? Which aren’t?
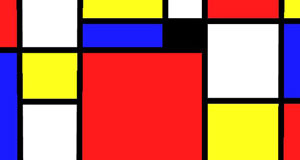
- What colors and layout works best in sharing the information?
- What graphs and graphics best convey information and data to the viewer?
- What is the order, or flow, of information?
You may want to take a moment to look back at your samples and discuss how various infographics are structured. Since the point of an infographic is to transfer knowledge and information quickly, the final poster should be informative, simple, engaging, and design-friendly.
If you are building infographics in Wixie, adjust the canvas orientation before you begin. You can use the painting and drawing tools to create simple shapes as well as add and color common infographic symbols from the Symbols and Icons folder in the Library.
Share
Print student posters and display in your room or around school. Publish the posters to PDF and image files to post on your classroom and school web site. Then, share them via blog, Edmodo, and social media, such as your school’s Facebook page or teacher’s Twitter account.

If the infographics are centered on a topic you are studying in your classroom, collect them into one file and use them as an electronic curriculum resource next year. You may also want to share this collection online for other students and teachers to use.
Assessment
The completed infographic poster is a great artifact for summative assessment of content knowledge and ability to communicate information. Conduct formative assessments as students are collecting information and data during the research process and designing a rough sketch plan for their poster. You may also want to evaluate planning and team work skills demonstrated during the process.
Resources
The beauty of data visualization - TED Talk by David McCandless
13 Tricks for better Infographic Designs
Standards
Common Core Anchor Standards for English Language Arts - Grade 6-8
Reading Theme
Key Ideas and Details
1. Read closely to determine what the text says explicitly and to make logical inferences from it; cite specific textual evidence when writing or speaking to support conclusions drawn from the text.
Integration of Knowledge and Ideas
7. Integrate and evaluate content presented in diverse media and formats, including visually and quantitatively, as well as in words.
Writing Theme
Text Types and Purposes
1. Write arguments to support claims in an analysis of substantive topics or texts using valid reasoning and relevant and sufficient evidence.
2. Write informative/explanatory texts to examine a topic and convey ideas, concepts, and information through the selection, organization, and analysis of relevant content.
Production and Distribution of Writing
4. Produce clear and coherent writing in which the development, organization, and style are appropriate to task, purpose, and audience.
5. Develop and strengthen writing as needed by planning, revising, editing, rewriting, or trying a new approach.
6. Use technology, including the Internet, to produce and publish writing and to interact and collaborate with others.
Research to Build and Present Knowledge
8. Gather relevant information from multiple print and digital sources, assess the credibility and accuracy of each source, and integrate the information while avoiding plagiarism.
ISTE NETS for Students 2016:
6. Creative Communicator
Students communicate clearly and express themselves creatively for a variety of purposes using the platforms, tools, styles, formats and digital media appropriate to their goals. Students:
a. choose the appropriate platforms and tools for meeting the desired objectives of their creation or communication.
b. create original works or responsibly repurpose or remix digital resources into new creations.
c. communicate complex ideas clearly and effectively by creating or using a variety of digital objects such as visualizations, models or simulations.
d. publish or present content that customizes the message and medium for their intended audiences.